Microsoft’s Mixer Mystery: Was Poaching Twitch’s Biggest Streamers Always Doomed to Fail?
by Joseph Ahn, Seth E. Jenny*, William CollisEmail: dr.sethjenny@gmail.com
Received: 02 Oct 2024 / Published: 15 Feb 2025
Abstract
In late 2019, Microsoft poached Twitch’s biggest streamers (e.g., former esports professional players Tyler “Ninja” Blevins, Michael “Shroud” Grzesiek) to catalyze their own upstart streaming platform called Mixer, which broadcast esports and gaming content. Mixer’s strategy centered on assuming that top streamers at Twitch develop their own communities and these audiences would follow the streamers across platforms and rehome to Mixer. The result was a failure, seeing Mixer shuttered less than one year later. The aim of this research was to explore why Mixer’s star-studded strategy failed through examining the potential existence of network effects (i.e., presence of power laws) at the streamer-audience level investigating whether streamers create loyal communities that stick across platforms. Using income data of individual streamers from Twitch following Clauset’s et al. (2009) methods, maximum-likelihood fitting with likelihood ratio tests were employed on Twitch streamer population incomes from August 2019 to October 2021. Results demonstrate that income for these content creators, including esports channels and professional esports tournaments, exhibit generally negative evidence for power law income characteristics at the tail of the distribution. This suggests that a preferential attachment mechanism likely does not drive revenue within the Twitch ecosystem, and, as such individual streamers (including esports professionals, esports tournaments, etc.) do not create their own networks in their audience and Mixer’s strategy was fundamentally flawed. Ultimately, Mixer should have acquired higher numbers of upper mid-tier streamers instead of a small handful of individual top streamers to target network-generating talent economically.
Highlights:
- Importing top streamers to Mixer did not weaken the defensibility of Twitch's business model, nor catalyze Mixer's competitiveness.
- Within live-streaming content creators, preferential attachment was not strong enough to drive power laws in the high-earning tail of streamers in the streamer sample income distribution.
- Streaming communities appear to not robustly build around streamers, even esports tournaments and professional players, in terms of income; when imported to other platforms these audiences do not reliably continue using the new platform.
- Strategic implications suggest future new platforms might aim for a “middle out” growth strategy compared “top down” through acquiring streamers ranked 51 to 345 for the same amount of money as the top 50 streamers while also attaining exclusivity rights with major esports events.
Introduction
In 2016, Microsoft acquired online streaming service Beam and rebranded it as Mixer (Novet, 2020). In 2017, Mixer started their challenge against Amazon’s Twitch for dominance of the “streaming” video content industry, where content creators (i.e., “streamers”) broadcast live to audiences reaching up to hundreds of thousands at the same time. This content was often recreational video game play or esports, including both current and former professional esports players streaming their gameplay or major tournaments and events broadcasting their matches. As seen in Figure 1 displaying the Esports Ecosystem (Besombes & Jenny, 2024), for major esports tournaments, leagues, and events, streaming platforms such as Twitch is a primary mechanism by which esports broadcasting content is delivered to audiences, where esports fans can watch and subscribe (Ahn et al., 2020; Gasparetto, & Safronov 2023).
As part of its long-term strategy, in August of 2019, Microsoft secured exclusive streaming contracts amounting to tens of millions of dollars with some of Twitch’s biggest streaming stars, including former professional esport Counter Strike player Michael “Shroud” Grzesiek, Cory “King Gothalion” Michael, and the megastar and former Halo and PlayerUnknown's Battlegrounds (PUBG) professional esports player Tyler “Ninja” Blevins, who alone signed a $20 to $30 million USD contract with Mixer as arguably the most famous streamer in the world at the time (Stephen, 2020a; Webster, 2019). In 2018, Ninja and Shroud were the top two individual Twitch streamers, amassing 232,002,134 and 101,278,823 hours watched, respectively, across that year (Goodling, 2018).
Yet within one year of poaching several of Twitch’s most popular streamers, the Mixer streaming platform was shut down, officially terminating service on July 22, 2020 (Gilbert, 2020; Warren, 2020). Despite the acquisition of the exclusive services of these top streamers, Mixer had failed to attract a large enough audience to be economically viable and compete with Twitch, as Twitch attracted 1.5 billion spectating hours during April 2020 amid the COVID-19 pandemic – twice as much as April 2019 – while Mixer only garnered 37 million hours watched during April 2020, which were similar statistics to April 2019, demonstrating an inability to scale operations (Needleman, 2020). No reliable source could be found which reports Mixer’s actual profit and loss. While Ninja and others had switched allegiance from Twitch for Mixer, it is curious why more viewers did not do the same. One possible reason is that the conventional wisdom around top streamers – that they build networked communities around themselves, which are loyal and would follow these streamers across platforms – may be false.
One way to investigate the presence of such communities is to test for the existence of “power laws”, a statistical phenomenon that can provide evidence for the strength of the streamer communities. That is to say, a power law is likely to appear if the phenomenon that Mixer is interested in – the largest and most successful streamers create a community affect that draws in more income and viewers at an accelerated rate – is occurring at a statistically significant level. While power laws are not guaranteed if preferential attachment exists, if a power law does not manifest, preferential attachment is likely not occurring. Other possible reasons for the non-appearance are discussed later.
Figure 1 – The Esports Ecosystem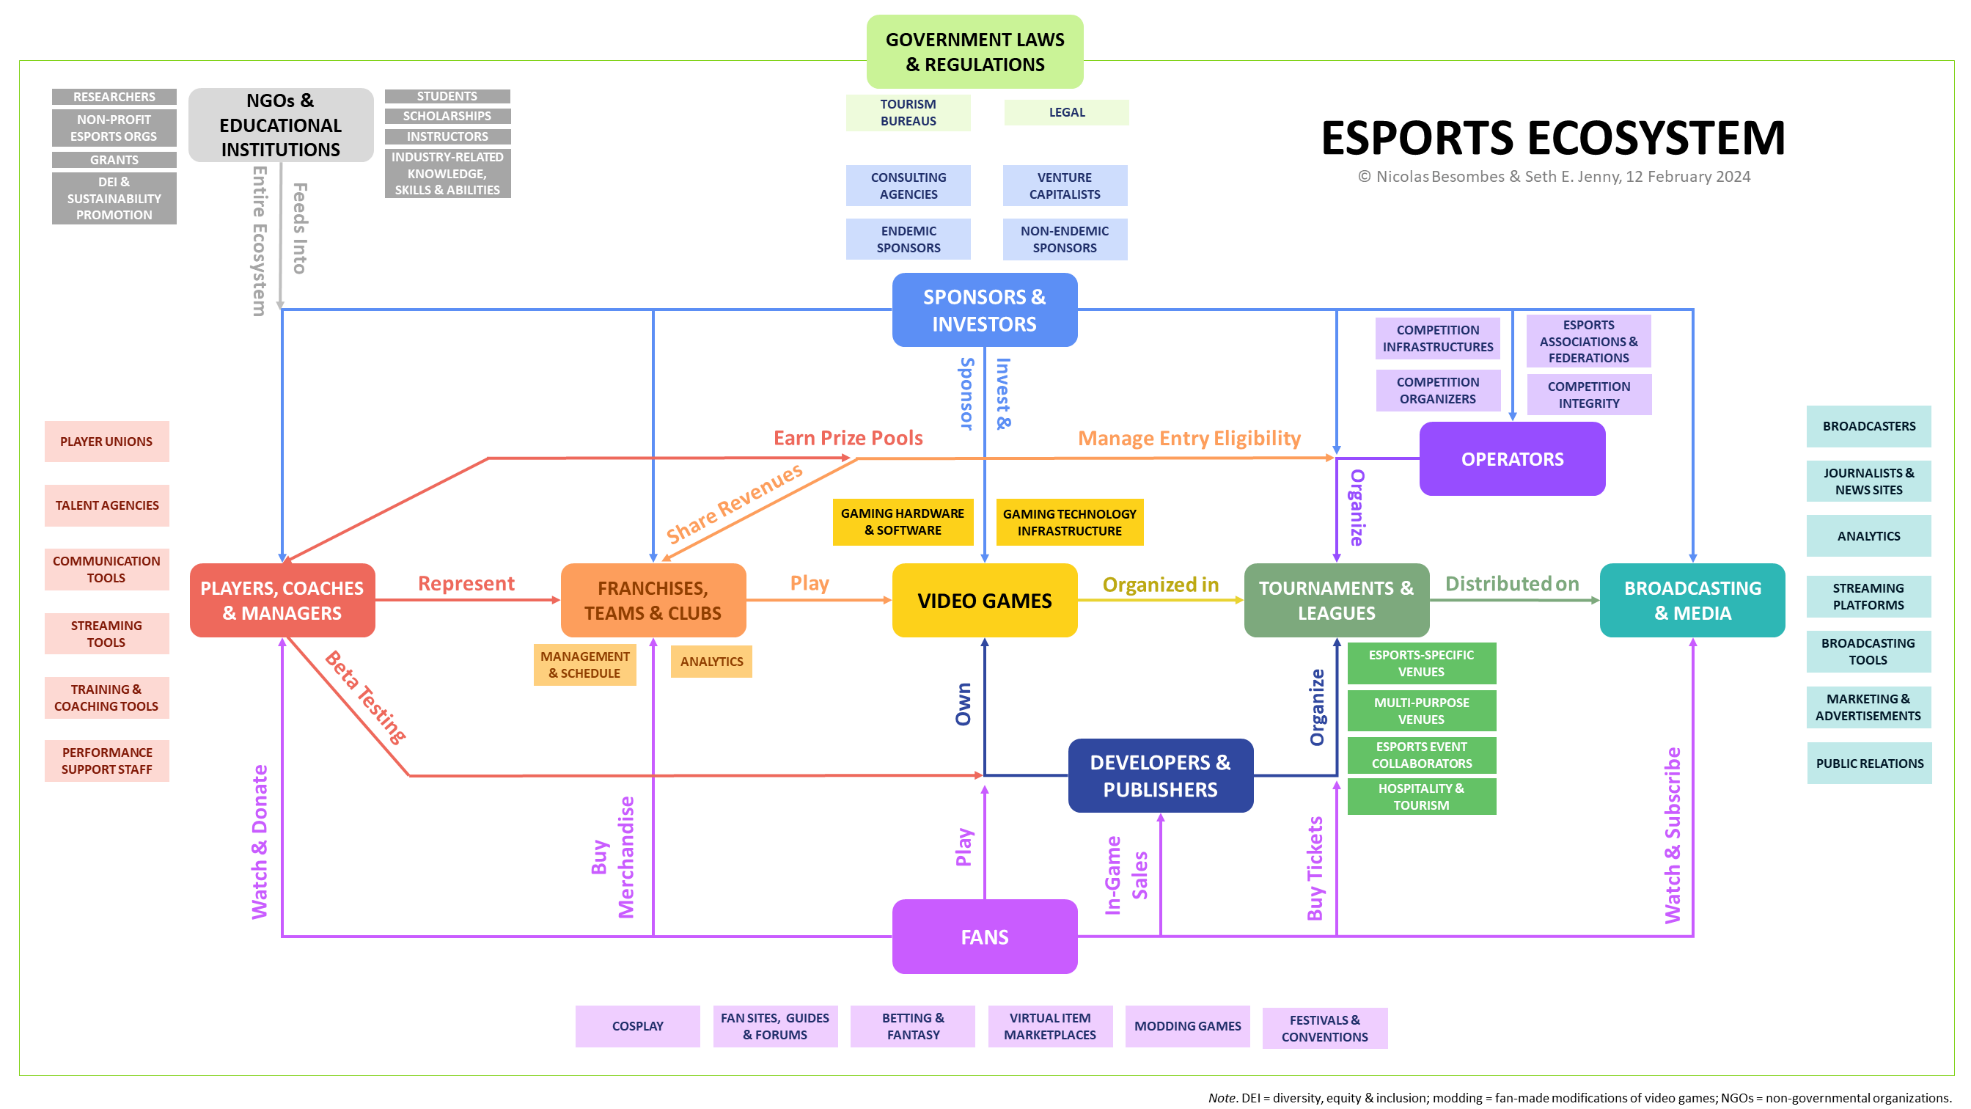 Note. Reprinted with permission from Jenny (2024).
Thus, this study analyzes the distribution of income processed directly through individual Twitch streamers, investigating the potential existence of power laws, network effects, and preferential attachment processes. Income was chosen as it is the most salient statistic from a business strategic standpoint. Implications regarding possible reasons why Mixer’s strategy failed are offered, along with practical recommendations for new future streaming platforms.
Network Effects and Power Law
A network is generally defined as having network effects if they display preferential attachment (Barabási & Albert, 1999), which captures the notion of “the rich get richer.” In other words, in a preferential attachment process, a party that already bears a higher level of the accumulated good sees higher rates of gain. In the context of a live-streaming social media platform network, this “good” could be wealth, total number of users, number of minutes watched, or other metrics. If the preferential attachment process is sufficiently powerful, the quantity under interest may follow what is known as a power law at the higher end of the tail. To help clarify terminology, Table 1 offers operational definitions of advanced terms used for this study.
Table 1 – Operational Definition of Terms|
Term |
Operational Definition |
|
Advertisement (i.e., Ad) Share Revenue |
The portion of revenue earned from advertisements displayed in the streamer's live channel and subsequently delivered to the streamer |
|
Emote |
A digital image shared in chat, often comical or humorous, that can reflect status on a digital platform if rare or purchased. |
|
Exponential Distribution |
A probability distribution is often used to model the time between independent events that happen at a constant average rate. Its tail decays rapidly, meaning extreme values (i.e., outliers) are rare. Unlike heavy-tailed distributions, exponential distributions predict that the likelihood of extreme events falls off exponentially, making them less likely. Examples include waiting times for a bus or radioactive decay. |
|
Heavy / Fat Tail |
Refers to distributions where extreme events (i.e., far from the mean) are more likely compared to thin-tailed distributions (like the normal distribution). The tail declines slowly, making rare events more frequent. Examples include power-law, lognormal, and Pareto distributions. |
|
Lognormal Distribution |
A type of distribution where the logarithm of the variable is normally distributed. While lognormal distributions are heavy-tailed, they are not power-law distributions because their tails decay faster than a power law (exponentially). In a lognormal distribution, extreme values are possible but less frequent compared to true power-law distributions. Examples include worldwide income distribution, stock price movements, and animal sizes. These distributions emerge under a more general form of random statistical growth processes as opposed to the specific preferential attachment process and represent the most general assumption one can make about heavy-tailed distributions. |
|
Meritocratic Effects |
Principle that individuals are rewarded based on ability and talent rather than other factors such as seniority or personal connections. |
|
Negative Revenue |
Outlier samples in this dataset, representing individual streamers that lost money while using the platform due to chargebacks or other reasons. |
|
Network |
In this study, a platform that benefits from network effects. |
|
Network Effect |
When the user value of a platform increases with its number of users. |
|
Parameter |
A numerical statistic of a population; in this case helping determine how the power law scales with the variables of interest. |
|
Positive Revenue |
Money earned by a streamer via the Twitch streaming platform. |
|
Power Law Distribution |
A distribution arising from a relationship between two variables, in which a change in one variable results in an exponentially relative change to the other. For example, worldwide wealth, the number of users across social networks, word usage, and earthquake size all follow power law distributions. If a preferential attachment process exists, a power law is likely to manifest, particularly under conditions without constraints such as limits on growth rate, old networks, or insufficiently connected networks. |
|
Power Law Tail |
The range of a power law relationship where changes in one variable results in only small changes to the other, visually appearing as a “long-tail” when this relationship is graphed. |
|
Preferential Attachment |
When the distribution of a quantity is based off prior distributions of that quantity (i.e., when those with a lot get more, and when those with little get less). |
|
Scaling Parameter |
Defines how quickly one variable increases as the other variable grows; in this case, how quickly income earned grows as the rank grows smaller (e.g. how much higher income is earned by the top-earning streamer compared to the second-highest earning streamer). |
|
Subscription Share Revenue |
Results when Twitch users pay to "subscribe" to a streamer, eliminating advertisements and earning other community-specific benefits such as exclusive emotes, for fees usually ranging from $4.99 to $24.99 per month. |
A power law is simply a relationship between two variables, where one variable scales exponentially with the other (Roman & Bertolotti, 2022). Mathematically, we state that a quantity “\(x\)” follows a power law if it is drawn from a probability distribution, where is known as the scaling parameter:
A scaling parameter is a value that shows how one measure changes as another measure grows. For example, it tells us how streamer incomes increase with their popularity.
The power law exists across many different phenomena in nature. Some of the earliest examples discovered are income distributions (e.g., “Pareto principle”; Tarascio, 1973), city populations (e.g., “Gibrat’s law”; Eeckhout, 2004), frequencies of words in texts (e.g., “Zipf’s law”; Cancho & Solé, 2002), and the distribution of the intensity of earthquakes (Mega et al., 2003). Mitzenmacher (2004) provides a review of such literature.
Specifically, these examples were shown to demonstrate a “power law tail.” The power law tail refers to the high end of the distribution (e.g. the largest cities, the most popular streamers, and the most intense earthquakes), where the frequency of events decreases slowly. This "long tail" represents rare but significant occurrences, such as extremely high incomes among a few top streamers, which may influence overall income patterns on streaming platforms. In a more germane space for this paper, social media sites such as Facebook, X (formerly Twitter), and YouTube all display significant network effects, which manifest in preferential attachment rates and thus power lawed tails in their user counts and revenue (Johnson et al., 2014).
However, as argued in Clauset et al. (2009), many subsequent discoveries of power laws relied upon poor understanding of the underlying mathematical phenomena, meaning that many so-called power law effect “discoveries” are false. As a result, Clauset et al. (2009) developed rigorous empirical techniques which were subsequently implemented in software packages, particularly the powerlaw package in Python (Alstott et al. 2014), which are applied in subsequent sections.
Of note, there are different levels of network effects. Twitch itself is likely to be a networked platform at large, and its user count may display network effects when compared against other networks, particularly other streaming sites (e.g., YouTube). Example evidence of Twitch’s overall cultural network effects resides in the specific “language” users have developed to communicate with each other on the network, such as its infamous “kappa” emote that signals the user is being sarcastic or ironic, is trolling (i.e., purposefully being disruptive; Jenny et al., 2024), or is simply acting playfully with the other user (see Alexander, 2018).
Past research argues that Twitch’s individual streamers themselves create sub-networks (Förderer, J., & Gutt, 2021; Teknos, 2024). Sub-networks could be the groups of followers/subscribers individual streamers aim to create. Indeed, streamers often refer to their “communities.” If it is true that streamers who join Twitch’s (2024) Partnership Program are sub-networks, this would be a critical factor in determining the success of Microsoft’s strategy of importing content creators to jumpstart a network.
Few past studies have examined preferential attachment processes in conjunction with economics surrounding esports and video gaming live-streaming content creators. Pagan and colleagues (2021) used Twitch viewer data in the chess and poker categories, applying Clauset et al.’s (2009) techniques, and found power law distributions. Findings suggested meritocratic effects for the distribution of viewership even against robust preferential attachment processes deliberately induced by Twitch’s recommendation algorithms. This is significant for the current investigation because it indicates that, while Twitch's algorithm may influence viewership, the fundamental success of streamers is governed by power law dynamics. In other words, a few top streamers may always dominate the platform in terms of viewership, regardless of algorithmic interventions. However, Pagan et al. (2021)’s work of studying income was limited to specific streaming categories instead of testing all streamers on the platform.
Moreover, Houssard et al. (2023) examined the same dataset of Twitch streamer income used in the current study, but the analytics were limited to the top 10,000 streamers by income. Houssard and colleagues (2023) found significant inequality in income distribution of streamers despite Twitch’s mechanisms supposedly favoring streamers with smaller audiences.
While Houssard et al. (2023) conducted a preliminary analysis finding that income distribution can fit with a power law with an exponent 0.8 for the top 1,000 streamers by income, the results were not very strong, with an R2 value of only 0.38. Significantly, unlike the current study, Houssard et al. (2023) also did not conduct any robustness tests on the power law finding as described by Clauset et al. (2009). Therefore, the purpose of the current study is to extend Houssard et al. (2023)’s work by expanding the population and conducting robust Clauset (2009)-style tests on the dataset as power laws, network effects, and preferential attachment is investigated in relation to individual Twitch streamer income.
Methodology: Twitch Streamer Revenue
This study tests whether preferential attachment processes exist at the individual streamer level by testing for the existence of power law tails. However, prior to applying power law analysis, Twitch streamer revenue data collection, analysis, and results must first be briefly discussed.
Twitch Streamer Revenue Data Collection
Over two years of data from August 2019 to October 2021 from Twitch streamer earnings were retrieved from a well-publicized data leak (Scullion, 2021). Twitch even confirmed this data leak (Tidy & Molloy, 2021) and other academic outlets have also confirmed this data, such as the scientific journal Nature (Houssard et al., 2023). This data included 2,398,315 unique streamers across that timeframe. The data included advertisement (ad) share and subscription share revenues, both defined previously in Table 1.
Twitch Streamer Revenue Data Analysis
Initial data cleaning and analysis were conducted using Microsoft Excel and STATA13 software, respectively. For every individual streamer, the following was collected: 1) streamer unique numerical ID, 2) ad share payment received, 3) the date the ad share payment was received, 4) subscription share revenue received, and 5) the date the subscription share revenue received. For each individual streamer, their ad share and subscription share revenues were summed to calculate their cumulative revenue across the entire dataset and across specific time frames (e.g., annual basis). During this initial analysis, it was found that 158,540 out of the total 2,398,315 unique streamers had a cumulative revenue that was non-positive (with only 462 streamers that had negative cumulative revenue), which were removed from our dataset leaving 2,239,775 individual streamers in the analysis.
Summary Statistics: Twitch Streamer Revenue
Table 2 below shows summary statistics for the calculated data, including cumulatively from across the entire dataset August 2019 to October 2021, for each year, and positive monthly income. For example, in Table 2, 25% of all streamers made $15 or less (lower quartile), while the top 25% of streamers made $989 or more (upper quartile).
Table 2 – Twitch Cumulative Revenue Summary Statistics for August 2019 to October 2021 (USD)|
Data Specification |
Minimum |
Lower Quartile |
Median |
Upper Quartile |
Maximum |
Mean |
Standard Deviation |
Total Number of Observations |
|
All Streamers, Cumulative Revenue (Aug. 2019 to Oct. 2021) |
-$485.1 |
$6.3 |
$43.0 |
$200.6 |
$23,787,446 |
$1,225.8 |
$37,770 |
2,398,315 |
|
Positive Income Only, Cumulative Revenue (Aug. 2019 to Oct. 2021) |
$0.01 |
$10.3 |
$452.5 |
$225.8 |
$23,787,446 |
$1,312.4 |
$39,078.7 |
2,240,214 |
|
Positive Income Only, Partial Annual Cumulative Revenue (Aug. 2019 to Dec. 2019) |
$0.01 |
$2.7 |
$17.6 |
$82.7 |
$2,866,985 |
$500.4 |
$9,247.2 |
607,503 |
|
Positive Income Only,
Annual Cumulative Revenue (Jan. 2020 to Dec. 2020) |
$0.01 |
$5,4 |
$32.4 |
$148.6 |
$7,266,778 |
$712.4 |
$14,920.6 |
1,420,521 |
|
Positive Income Only, Partial Annual Cumulative Revenue (Jan. 2021 to Oct. 2021) |
$0.01 |
$5.5 |
$32.2 |
$141.9 |
$18,876,128 |
$835.2 |
$27,058.8 |
1,944,330 |
|
Positive Income Only, Average Monthly Revenue (Jan. 2019 to Oct. 2021) |
$.0003704 |
$0.9 |
$4.1 |
$17.7 |
$881,016.5 |
$66.5 |
$1,523.4 |
2,240,214 |
Brief Discussion: Twitch Streamer Revenue and Monthly Averaging of Revenue
A major takeaway from Table 2 is that the vast majority of the streamers in this sample do not earn any revenue at all, or in very small amounts when compared to the top earners. The third quartile and the mean values of annual revenue are all much lower than the maximum, and are less than $1,000.
Observing cumulative lifetime revenue over the entire dataset time period (Table 2, row 2), the mean cumulative revenue is much higher than the median, indicating a heavy right skew in the cumulative revenue distribution. This accords with prior assumptions of Twitch streamers, as the highest percentile of streamers earn the vast majority of the earned revenue, which explains why the highest performing streamers are likely able to negotiate greater revenue-sharing deals.
The last row of Table 2 provides summary statistics for Twitch streamers who earned positive income on a monthly basis. That is, we divide the total income earned by the streamer by the total amount of months they were available in the database, providing the average income earned by streamers per month they were in the database. This was done to control for the effect of the total amount of time that streamers have streamed; the longer streamers stream, the more time they have to earn income on average. The subsequent empirical analyses on this paper will primarily utilize this monthly revenue to control for this lifespan effect.
Methodology: Power Law Robustness Test
As discussed in Alstott et al. (2014), robustly testing for power laws involves applying likelihood ratio tests comparing the empirical data’s fit to two distributions, and seeing which distribution is most likely to have generated the empirical data. As such, it can only be robustly stated at any time that the data fits a power law better than other distributions, rather than stating that a power law distribution is the best fit of any possible distribution to the data.
Heavy Tails, Exponential Distribution, and Lognormal Distribution
Two primary tests must be conducted to investigate the possible generating mechanisms of the Twitch data distributions, including:- The empirical distribution must be compared against both power laws and exponential distributions to test for the potential existence of a heavy tail.
- The empirical distribution must be compared against both power laws and lognormal distributions, to determine whether preferential attachment processes or random multiplicative growth processes are more likely to be generating the empirical data.
The exponential distribution is the absolute minimum alternative candidate for evaluating the “heavytailedness” of the distribution. The reason is definitional: the typical quantitative definition of a ”heavytail” is that it is not exponentially bounded. Thus, if a power law is not a better fit than an exponential distribution…there is scarce ground for considering the distribution to be heavy-tailed at all, let alone a power law. (p. 8)
The second test is determined as multiplicative random growth is one of the most general and “generic” distributions that can lead to heavy tails. Just as normal distributions are considered one of the most generic assumptions for any random distribution due to the Central Limit Theorem, the same applies for lognormal in growth processes and heavy tailed distributions.
In intuitive terms, the two tests are asking: first, does a heavy tail even exist? If it does not exist, then a power law fit is already ruled out. If a heavy tail does exist, is it more likely to be generated by preferential attachment according to the hypothesis of the best streamers creating communities? Or is it more likely to be a random growth process and thus lead to lognormal outputs?
Dataset Trimming or Choosing \(x_{\text{min}}\)
In testing for power laws, the choice of dataset trimming is critical. As described in Clauset et al. (2009), testing for power laws is particularly difficult even when preferential attachment processes occur; in practice, few empirical phenomena follow the pattern for all values of the variable of interest. More often, power laws apply only for “the tail”, or in mathematical terms, for values greater than some minimum value,\(x_{\text{min}} >= 0\).
On the other hand, \(x_{\text{min}}\) chosen too high can also cause false identification of power laws, as the description of any curve, when sufficiently granular, will appear as a line, an observation dating back to Isaac Newton. That is, choosing too small a set of observations at the top of the distribution (i.e., choosing too high an \(x_{\text{min}}\) ), will result inevitably in a linear appearance in the log-log graph, due to the continuity of the curve. For example, choosing only the top two observations means the fit of the curve is, by definition, a line connecting the two points. In this case, any two points can be used to demonstrate the existence of a “power law” and thus is not really evidence for a power law at all.
As such, in the current study, choosing an appropriate \(x_{\text{min}}\) is of great importance. In general, the lower the \(x_{\text{min}}\) value found where a power law relationship holds in a robust fashion, the stronger the assertion that a power law exists for the tail or a significant portion of the population. In other words, the general intuition is to choose \(x_{\text{min}}\) as low as possible where power laws appear, if at all. This study chooses multiple values of \(x_{\text{min}}\), going from lowest to highest, to study where power laws begin to emerge, if at all, across streamer monthly average income. The values of \(x_{\text{min}}\) chosen and the reasoning behind their selection are provided in the following sections.
Hypotheses and Distribution Comparison Testing: Likelihood Ratio Goodness-of-Fit Tests
For each value of \(x_{\text{min}}\), a power law distribution, an exponential distribution, and a lognormal distribution are fitted to the data for all streamers whose monthly average income exceeds \(x_{\text{min}}\). Then for each value of \(x_{\text{min}}\) analyzed, the scaling factor α is calculated and goodness-of-fit tests conducted. Specifically, Kolmogorov-Smirnov (KS) distance is calculated first between the data and a power law distribution, then compared against the KS distance between the data and exponential or log-normal distributions using a likelihood ratio test. Within this test, if the loglikelihood is positive, then the data is more likely to have been drawn from the power law distribution, and if negative, the more likely it is that it was drawn from the comparison distribution (i.e., exponential or lognormal). The p-value determines the significance of this finding; in other words, if the resulting p-value of this likelihood ratio is greater than 0.05 while the loglikelihood is positive, the power law is a plausible fit for the data; otherwise, it is rejected. This study’s two hypotheses are:
Testing for heavy tails (null and alternative hypothesis 1):H01: Both power law and exponential models are equally close to the Twitch streamer income data.In other words, the income distribution data is not convincingly explained by one model over the other, and has a high chance of being random noise.
HA1: The power law model or exponential model provides a significantly better fit to the data than the other depending upon the sign of the loglikelihood ratio.
Specifically, if the loglikelihood ratio is negative, then the exponential model is a significantly better fit to the data, meaning the distribution is not heavy tailed. If the loglikelihood ratio is positive, then the power law model is a significantly better fit, meaning the distribution at least displays a heavy tail.
Testing against lognormal distributions (null and alternative hypothesis 2):H02: Both power law and lognormal models are equally close to the Twitch streamer income data.In other words, the income distribution data is not convincingly explained by one model over the other, and has a high chance of being random noise.
HA2: The power law model or exponential model provides a significantly better fit to the data than the other depending upon the sign of the loglikelihood ratio.
Specifically, if the loglikelihood ratio is negative, then the lognormal model is a significantly better fit to the Twitch streamer income data, meaning the distribution is likely to be generated by random multiplicative effects akin to animal size growth. If the loglikelihood ratio is positive, then the power law model is a significantly better fit, meaning the distribution is likely to be power-lawed and may be generated by a preferential fit process.
Power Law Data Analysis and Results
As stated above, analyses at multiple choices of were conducted in increasing order and attempts were made to observe when empirical evidence of power laws emerged, if ever. Table 3 displays these power law analyses. Each test’s results will now be explained.
Table 3 – Power Law vs. Exponential vs. Lognormal Testing Results|
Test # |
\(x_{\text{min}}\) Value |
# of Streamer Accounts |
Power law model fit accepted? |
alpha |
Loglikelihood vs. exponential |
p-value expo-nential |
Loglikelihood vs. lognormal |
p-value lognormal |
Notes |
|
1 |
$382.01 |
34,514 |
N |
2.1277 |
0 |
0.0129 |
0 |
0.0129 |
Package-determined “optimal fit” across all data |
|
2 |
$3.52* |
35,796 |
N |
1.2086 |
3,470.4574 |
0.0002 | -20,139.044 |
0 |
Twitch partners: Officially recognized by Twitch as core value-providers to platform |
|
3 |
$1181.70 |
10,000 |
N |
2.2249 |
3,637.4360 |
0 |
-15.7985 |
0.001 |
Top 10,000, following Houssard et al. (2023) |
|
4 |
$7,779.95 |
1,000 |
N |
2.4292 |
165.58223 |
2.268e-05 |
-6.6412 |
0.043 |
Starting point for testing all top N |
|
5 |
$10,900.73 |
648 |
N** |
2.514 |
94.5316 |
0.0006 |
-4.3608 |
0.0997 |
Lowest value for which all fits restricting further show evidence of power laws at 5% significance |
|
6 |
$17,567.03 |
345 |
N** |
2.7325 |
54.2946 |
0.002 |
-0.9448 |
0.41 |
Value at which KS distance to power law fit is lowest while still being statistically significant |
Test 1: Minimum KS Distance (Package fit)
Test 1 (Table 3) was conducted using the entire set of streamers with positive revenue (n = 2,240,215 individual streamers). The powerlaw package determines the “optimal fit” under the following criteria, according to Alstott et al. (2014):
The methods…find this optimal value of xmin by creating a power law fit starting from each unique value in the dataset, then selecting the one that results in the minimal Kolmogorov-Smirnov distance, D, between the data and the fit. (p. 3)
It is important to note that minimizing KS distance to a power law fit does not guarantee statistical significance of the existence of a power law under the Clauset et al. (2009) test; the two concepts are not equivalent. Applying the powerlaw package fitting method, an \(x_{\text{min}}\) value of $382.01 was determined. This left a total of 34,514 streamers who earned at least \(x_{\text{min}}\) in lifetime revenue to be fitted to the power law distribution.
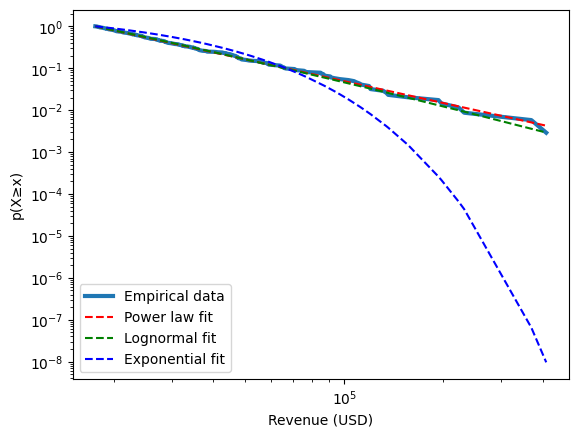
Appendix A’s log-log graph shows that the empirical observed distribution of revenue is closer to a lognormal rather than a power law fit. The KS distance to a fitted power law distribution is 0.0129. Compared against an exponential distribution, the loglikelihood statistic was given as 16,338.52 with a p-value that could only be recorded as 0 by the computer system, as the value is too small at the precision level provided by the software. As the loglikelihood value is above 0 and the p-value above 0.05, it is possible to accept hypothesis HA1 that there is a heavy tail in the distribution.
Compared against a lognormal distribution, a loglikelihood statistic of -61.3459 was calculated with a p-value so low it was recorded as 0. Given the negative value of the loglikelihood value and the significant p-value, there is enough evidence to reject the null hypothesis H02 and accept the hypothesis HA2 for this \(x_{\text{min}}\) value and conclude that the empirical distribution of cumulative revenue is likely to follow a lognormal, and not follow a power law distribution at 95% statistical significance.
Test 2: Regular Streamers on Twitch (i.e., Proxy for “Twitch Partners”)For Test 2 (Table 3), the population was limited to that of “Twitch Partners”. The Twitch Partnership Program allows streamers to apply for partnership status, which entitles them to higher shares of revenue from advertisements and subscriptions. At that time, 500 average viewers was generally known as the threshold to join the Twitch Partnership Program; despite current threshold's being less (Stephen, 2021; Twitch 2024). To proxy for this, only streamers having at least $1.75 total ad revenue were included for this test. $1.75 in ad revenue corresponds to approximately 500 regular viewers – calculated by applying 50% to Twitch’s policy of $3.50 per 1,000 views(Stephen, 2020b). This left a data set of 35,796 observations (i.e., individual streamer accounts).
When a power law was fitted to this dataset, this resulted in a KS distance to a power law distribution of 0.2949.
Compared against an exponential distribution, a loglikelihood value of 3470.45 was calculated, with a p-value of 0.0002. Given the positive value of the loglikelihood and the p-value below 0.05, it is possible to conclude that the distribution again shows a heavy tail. It is possible to accept hypothesis HA1 that there is a heavy tail in the distribution.
Compared against the lognormal distribution, the results were a loglikelihood value of -20,139.044, and a p-value that could only be recorded as 0 by the computer system, as the value is too small at the precision provided by the software. It is possible to accept hypothesis HA2 that the data follows a lognormal distribution (and not a power law distribution).
In other words, while the tails are again heavy, the power law model should be rejected for the monthly income distribution of the population of Twitch Partners. As noted above, this exercise is different from the other tests conducted in that Twitch Partners does not strictly truncate the dataset below a certain threshold income; instead, ad revenue truncations were used, meaning the dataset was filtered across the entire income distribution instead of only at the low end. As seen in Appendix B, the lower end of this log-log graph’s x-axis is significantly smaller than in the other log-logs graphs. This is why the lognormal graph looks notably curved compared to the others; this log-log graph is “zoomed out”.
Test 3: Top 10,000 Twitch Streamer Accounts – Following Houssard et al. (2023)Following the general methodology of Houssard et. al. (2023), for Test 3 (Table 3) we selected the top 10,000 streamers by total income earned. The KS distance test of the empirical distribution to a fitted power law distribution was 0.0142. The log-likelihood ratio comparison statistic against a lognormal model is -15.7985, which corresponds with a p-value of 0.001. This results in the null hypothesis of a power law fit being rejected. Appendix C’s log-log CCDF graph also displays the data aligning more with a lognormal distribution than power law.
Tests 4, 5, and 6: Top 648 Twitch Streamer Accounts while Systematically Restricting from the Top 1,000 Twitch Streamer AccountsNext, the exercise was repeated at higher and higher truncations (smaller and smaller datasets beginning from the highest earners down) to determine if there were any values for which a power law fit might emerge at 5% statistical significance under the log-likelihood test used. Test 4’s (Table 3) results at datasets larger than the top 1,000 observations (i.e., top 1,000 highest-earning streamers) will not be discussed except to note that the power law did not emerge with statistical significance. The power law fit, KS-distance, log-likelihoods, and p-values were calculated at all values ranging from the top 1,000 earners down to the top 50 earners. The calculations were stopped at 50 to allow sufficient points in the dataset for robust distribution fitting.
Compared against an exponential distribution, the tests show a loglikelihood value of 3,637.44 with a p-value of 0. Compared against a lognormal distribution, the tests show a loglikelihood value of -15.8 with a p-value of 0.001. Again, the presence of heavy tails is statistically significant while the lognormal model must be accepted (in favor against the power law model) at 95% significance. Indeed, a power law fit must be rejected for any N larger than 648, indicating that preferential attachment is not expressed for the vast majority of the population.
For N smaller than 648, while the data remains heavy-tailed, hypothesis H02 cannot be rejected for the tail. In other words, while loglikelihood values remain negative meaning that lognormal models are still a better fit for the Twitch streamer population income, a power law model fit cannot actually be rejected.
Figure 2 plots p-values against truncations (i.e. restricting the dataset to the top N monthly income streamers at different values of N from 50 to 1,000) and shows that the p-values for the power law test, which had persistently been around or lower than 5%, rise persistently at N between 600 and 700. As discussed above, the power law cannot be rejected only in the extreme tail – in this case, only in the highest-earning 0.03% of the population.
Figure 2 – p-values to Power Law Versus Lognormal Test at Different Truncations of Size N
The question remains of whether there exists an N at which the power law fit cannot be rejected at 95% significance and fits the data “optimally”. Following inspiration from the Alstott method described earlier, KS distance was plotted against N to determine at what N KS distance to a power law distribution is minimized while also being statistically significant at 95%.
Figure 3 shows that KS distance begins to drop significantly at approximately n = 450, while reaching a minimum at N = 345. Interestingly, KS distance rises significantly again after this, suggesting the power law does not fit as well for values of N smaller than 345.
Representing Test 6 (Table 3), Appendix D shows the log-log graph at N = 345. The KS distance test to a fitted power law distribution was 0.0229. Compared against a normal distribution, the log-likelihood ratio comparison statistic -0.2261, which corresponds with a p-value of 0.6778, which means the hypothesis H02 cannot be rejected and neither model fits the data better, although the distribution is still heavy tailed.
Figure 3 – Kolmogorov-Smirnov Distance to Power Law Fit at Different Truncations of Size N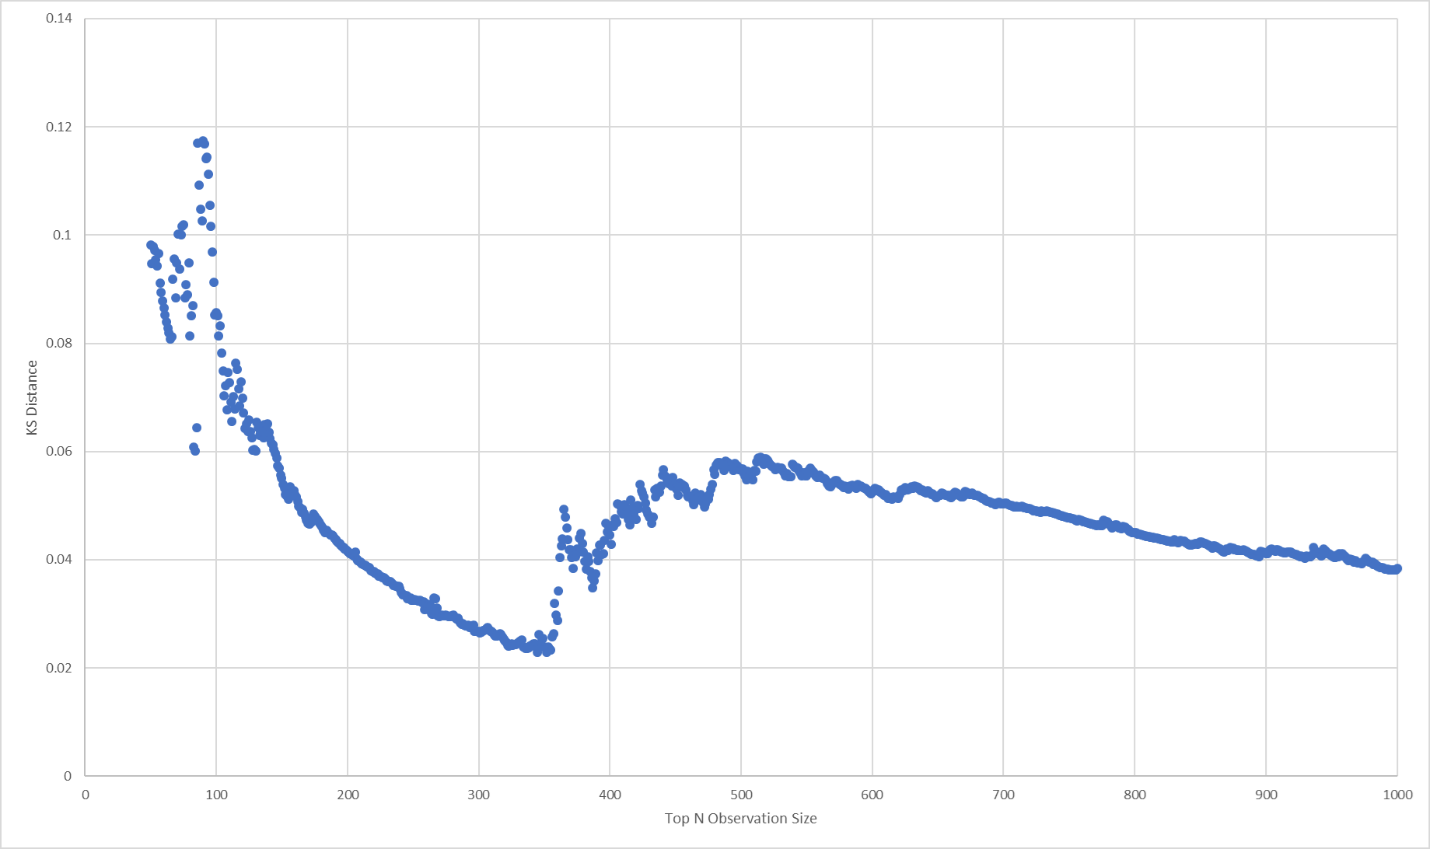
Discussion
Overall, the evidence indicates that while heavy tails exist at all values of \(x_{\text{min}}\), the power law model fit should be rejected for all values of truncations of the dataset, except for truncations of 648 or less. For these extreme tail values, the power law model fit for the data can neither be accepted nor rejected with statistical significance; the test results indicate that the distribution is more likely to have been drawn from a lognormal distribution but statistical significance at 95% cannot be verified.
The lack of existence of preferential attachment at this scale suggests that the reason that Mixer did not succeed in constructing a significant platform-wide viewership network was because the highest-earning individual streamers are, contrary to popular belief, not creating power-lawed income-earning Twitch communities. Emergence of communities at the top 648 or 345 members of the streamer population is possible, but not yet provable with statistical significance at 95%. Similarly, given the results for broader population segmentations, the previously discussed phenomenon that smaller populations tend to result in linear fits, and finally, Mixer’s own poor performance, the evidence seems to point to a lack of such communities.
Why is this the case? What is preventing streamers, esports events, and other major esports/gaming creators from generating significant communities? It seems that most streamer income are a result of random multiplicative inputs. Further, it appears that the communities are especially important in retaining audiences, even if the streamer is able to bring significant audiences initially, and thus streamers are unable to important significant audiences permanently to a platform. Stewart and Gilbert (2020) suggested that streamers did successfully bring their audiences to Mixer, at least while the streamers were live initially. For example, 85% of Ninja’s viewership did come to Mixer for his stream (Ninja’s first stream provided over 50% of Mixer’s entire audience) (TwitchTracker 2024). According to ex-Mixer employee Milan Lee, the top streamers communities never really stayed, and when Ninja stopped his first stream, only 6% of his audience remained on Mixer (Stewart & Gilbert, 2020). It is possible the cost of audiences learning the intricacies of a new streaming platform or changing habits of tuning into a new platform may have been too great as well.
According to Stewart and Gilbert (2020), Mixer opted for an “either-or” approach in purchasing top streamers versus investing in fostering the organic growth of Mixer’s homegrown channels, such as fostering tournaments or events specific to Mixer, or by cultivating other primary-to-Mixer individual streamers. Perhaps jointly providing tools to foster growth within Mixer while also purchasing some networks of streamers may have allowed the platform to provide the complete value proposition that audiences were looking for. However, according to the data, the top 648 highest earning streamers earned 30% of the entire revenue generated in the dataset. As such, the evidence appears to indicate a mixed set of behaviors among audiences; many move to other networked community streamers when one of their “main” streamers are not live, while others check smaller non-network-generating streamers.
Therefore, Mixer’s strategy may have been fundamentally sound, but the execution was poor. Better results may have occurred if Mixer had gone farther and imported larger communities of streamers or major exclusive esports events and achieved a “critical mass” of content. In other words, a better strategy for Mixer may have been to “poach” many streamers just below Twitch’s Top 50 income generators rather than only a select few at the top (like Ninja and Shroud) which require exorbitant contracts. This is discussed in depth in the section on strategic implications.
From a bargaining power perspective, the results suggest that Twitch as a platform is difficult to disrupt by attempting to acquire a handful of streamers. Indeed, bargaining power for Twitch is compounded by streamers’ inability to retain audiences – this in turn increases the power of Twitch as the primary platform of streamers, and further increases its bargaining power. On the other hand, the collected evidence implies that rather than bargaining power being concentrated in a handful of top streamers, instead a diverse collection of “average” streamers are still a necessity for the success of the overall platform. Houssard et al. (2023) also suggests that smaller streamers have more loyal networks, since they can interact more with each individual viewer. There may be other effects that arise solely in the median (views and income) streamer population that contribute to their overall effectiveness for a platform. Community engagement on platforms like Twitch often revolves around live chat during streams. Viewers who frequently comment, especially with monetary donations that appear on the stream, can gain recognition as “super fans” by the streamer and other viewers. However, as a streamer grows in popularity, it becomes more difficult to stand out due to the sheer volume of messages and increasing donation amounts needed to be featured. As a result, gaining a “super fan” reputation is harder with larger streamers, which could lower switching costs for streamers as fans would need to rebuild their status on a new platform. More research is needed on this.
Strategy Implications
Based on this study’s results, one can deduce some potential strategy implications for future actors who may wish to compete against established platforms hosting content creators. First, streaming platforms should attempt to gain more community-building streamers rather than less, even if they are less popular on an individual basis. According to the data, for approximately the same cost of the top 50 streamers, Mixer may have been able to acquire the exclusive services of streamers ranked from 51 to 345 and imported several hundred communities (assuming income is proportional to both viewer cost and the price of securing exclusive contracts). While acquiring the same number of overall viewers, Mixer could have provided more incentives to these audiences to remain on the platform when their primary streamer is not live due to the greater breadth of content creators.
Mixer could also have focused upon acquiring exclusivity with major esports events such as Dota 2's the International, the League of Legends World Championships, the World Championship Series in Starcraft II, and more. As the decision-making for hosting these events on various platforms is concentrated at the firm level, Microsoft may have been able to negotiate such agreements with partner firms and secured additional viewership at this level. If all major esports events were channeled through Mixer, a significant audience may have been attracted and retained. Additional research can focus upon the effect of esports events on overall platform viewership and retention.
Moreover, potential future actors should also consider investing in tools that more effectively foster organic growth of homegrown communities. Indeed, this attempt may have already taken place; YouTube Live employed a strategy of signing prominent live streamers, such as LilyPichu, to limited gains (Diaz, 2022). Instead, some attribute YouTube Live’s growing traction to its focus on building a native community, by converting its static video on demand (VOD) content creators into live streamers (Grayson, 2022). Such creators tend to have small- or medium-sized followings on other streaming platforms. As a result, YouTube has steadily grown its live streaming business. For instance, over the same duration as this study’s data, YouTube saw its total live streamed hours per quarter nearly double, from $723M USD in Q1 2019 to $1,216M in Q4 2021 (Statista, 2024). This success indeed suggests that a “middle out” growth strategy for streaming platforms may be more effective than a “top down” strategy.
Limitations and Future Research
This study’s findings are limited to the Twitch streaming platform over a specific three-year period only. Therefore, any generalizations beyond this scope are assumptive. Future research could seek to replicate this analysis of income distributions for Twitch over a wider timeframe, utilizing data from competitive services such as YouTube or Kick, or make revenue comparisons of live-streaming platforms prominent in varying cultures (e.g., Huya Live, AfreecaTV), to investigate a wider variety of circumstances. Qualitative methods might be employed investigating reasons why viewers may or may not migrate to a new streaming service.
Another limitation is that the study’s data set only covered 2019 to 2021. It is possible that these were unusual years for the live-streaming industry, and therefore produced anomalous results, impacted by the global COVID-19 pandemic which stimulated social distancing and more online communication (Besombes & Jenny, 2023). Moreover, many billions of dollars of venture capital flowed into the gaming industry during this time to catalyze new companies (Ahn et al., 2020; Takahashi, 2021); perhaps this resulted in distortions in the market for viewing games online. However, one could argue that both platforms had an equal environment to thrive, and this may have been a perfect opportunity for Mixer to demonstrate profitability but was not able to do so. Future analysis could explore preferential attachment across different or over a greater time series.
An additional potential limitation of the data is that the unique streamer identifications provided in the dataset do not allow for identification of a single streamer that may possess multiple accounts. However, due to the exponential nature of power laws, a streamer with multiple top accounts cannot “add” their way to generate a preferential attachment process, so the results still hold.
Discrepancies between the viewing and income processes may explain why importing the most “meritocratic” (i.e., popular) streamers still results in the failure of the Mixer platform. While potential hypotheses were provided, the specific mechanisms for these discrepancies were beyond the scope of this study. Future studies might research these mechanisms.
Future research could also investigate the strength of the “critical mass” hypothesis discussed above by diving into audience viewing habits. When a popular streamer goes offline, what happens to his or her audience? Do they go offline or remain on the platform? Do they seek out other popular streamers or focus by category? Is it possible to calculate a “critical mass” of streamers whose collective audiences can maintain a certain volume of continuous viewership?
Primarily outside the scope of this article, future studies could investigate income per view, which could be greater the smaller the streamer’s viewership (i.e., streamers who just make partner versus the top streamers) based upon the potential for greater interaction from the streamer with each individual viewer.
Future research could also investigate content subcategories within live-streaming platforms. For example, different genres of streamed video games and their related communities of consumers may exhibit stronger or weaker network effects. For example, is this effect particularly pronounced for esports with strong interconnected communities, such as Starcraft II? This could also be extended to analysis of so-called “Just Chatting” or “IRL” live streamers who do not play games, but instead host talk-show style discussions emphasizing their personalities. A final potential area of future research could be to examine user behaviors for evidence of network effects and fungibility on other popular gamer-focused platforms, such as the social media communications platform Discord. Such findings could elucidate if there are unique properties of the gamer-oriented markets that create the phenomena observed in this study, or if they are fundamental to the structure of the modern streaming marketplace.
Conclusion
Streaming is an integral part of the esports system, with subscriptions and other streaming platform driven revenue providing an essential income stream for most esports and video gaming professionals (Jacobson, 2021). This study analyzes whether esports professionals and other esports stars are successfully able to generate sub-communities that express their preference for the stars with power-law-tailed income contributions. The evidence supports that that Twitch streamers do not successfully create sub-networks with significant preferential attachment processes. As such, Twitch’s competitive advantages include additional entire platform-level effects beyond the presence of several popular streamers and esports events. Potential future research revolves around what these additional effects or resources are and whether some may be imported effectively. Overall, this study revealed that streamers do create communities about themselves, but this value may not be easily fungible barring other conditions. Streamer value may be largely intrinsic to their specific platform.
Conflicts of Interest and Source of Funding
No conflict of interest or financial disclosures pertaining to this manuscript exists.
References
- Ahn, J., Collis, W., & Jenny, S. (2020). The one billion dollar myth: Methods for sizing the massively undervalued esports revenue landscape. International Journal of Esports, 1(1). https://www.ijesports.org/article/15/html
- Alexander, J. (2018, May 14). A guide to understanding Twitch emotes: Some of Twitch’s most popular emotes, explained. Polygon. https://www.polygon.com/2018/5/14/17335670/twitch-emotes-meaning-list-kappa-monkas-omegalul-pepe-trihard
- Alstott, J., Bullmore, E., & Plenz, D. (2014). powerlaw: a Python package for analysis of heavy-tailed distributions. PloS ONE, 9(1), e85777. https://doi.org/10.1371/journal.pone.0085777
- Barabási, A. L., & Albert, R. (1999). Emergence of scaling in random networks. Science, 286(5439), 509-512. https://doi.org/10.1126/science.286.5439.509
- Besombes, N. & Jenny, S. E. (2023). Paradoxical Effects of the Health Crisis within the Esports Industry: How French Esports Organizations Illuminate the Perceived Revenue Growth Façade. In Andrews, D., Thorpe, H. & Newman, J. (eds.), Sport and Physical Culture in Global Pandemic Times: COVID Assemblages, Palgrave Macmillan. https://doi.org/10.1007/978-3-031-14387-8_29
- Cancho, R. F. I., & Solé, R. V. (2002). Zipf's law and random texts. Advances in Complex Systems, 5(1), 1-6. https://doi.org/10.1142/S0219525902000468
- Clauset, A., Shalizi, C. R., & Newman, M. E. (2009). Power-law distributions in empirical data. SIAM Review, 51(4), 661-703. https://doi.org/10.1137/070710111
- Devroye, L., Györfi, L., & Lugosi, G. (1996). A probabilistic theory of pattern recognition. Springer.
- Diaz, A. (2022, July 7). Popular streamer LilyPichu takes exclusive deal with YouTube. Polygon. https://www.polygon.com/23198801/lilypichu-offlintetv-exclusive-deal-youtube-twitch-streamer
- Eeckhout, J. (2004). Gibrat's law for (all) cities. American Economic Review, 94(5), 1429-1451. https://doi.org/10.1257/0002828043052303
- Förderer, J., & Gutt, D. (2021). The effects of platform superstars on content production: Evidence from Ninja. Platform Strategy Research Symposium, Boston University. https://questromworld.bu.edu/platformstrategy/wp-content/uploads/sites/49/2021/07/PlatStrat2021_paper_3.pdf
- Gasparetto, T., & Safronov, A. (2023). Streaming demand for eSports: Analysis of Counter-strike: Global offensive. Convergence, 29(5), 1369-1388. https://doi.org/10.1177/13548565231187359
- Gilbert, B. (2020, June 22). Microsoft just released top streamers Ninja and Shroud from their contracts as it shutters Mixer, after spending millions on exclusive deals with them. Business Insider. https://www.businessinsider.com/ninja-and-shroud-are-free-agents-as-microsoft-kills-mixer-2020-6
- Goodling, L. (2018, December 30). The most popular individual streamers on Twitch in 2018: Ninja amassed nearly a quarter billion hours watched in 2018. Dot Esports. https://dotesports.com/culture/news/the-most-popular-individual-streamers-on-twitch-in-2018
- Grayson, N. (2022, July 15). By signing stars, YouTube aims to replicate Twitch’s secret weapon: culture. The Washington Post. https://www.washingtonpost.com/video-games/2022/07/15/twitch-youtube-myth-lilypichu-ludwig
- Houssard, A., Pilati, F., Tartari, M., Sacco, P. L., & Gallotti, R. (2023). Monetization in online streaming platforms: an exploration of inequalities in Twitch. tv. Scientific Reports, 13(1), 1103. https://doi.org/10.1038/s41598-022-26727-5
- Jacobson, J. (2021). The essential guide to the business & law of esports & professional video gaming. CRC Press.
- Jenny, S. E. (2024). Research+. https://www.sethjenny.com/research
- Jenny, S. E., Besombes, N., Brock, T., Cote, A. C., & Scholz, T. M. (2024). Key terms definitions. In S. E. Jenny, N. Besombes, T. Brock, A. C. Cote, & T. M. Scholz (Eds.), Routledge Handbook of Esports (pp. 673-694). Routledge. https://doi.org/10.4324/9781003410591-72
- Johnson, S. L., Faraj, S., & Kudaravalli, S. (2014). Emergence of power laws in online communities: The role of social mechanisms and preferential attachment. Mis Quarterly, 38(3), 795-A13. https://www.jstor.org/stable/26634997
- Mega, M. S., Allegrini, P., Grigolini, P., Latora, V., Palatella, L., Rapisarda, F. A., & Vinciguerra, S. (2003). Power-law time distribution of large earthquakes. Physical Review Letters, 90(18), 188501. https://doi.org/10.1103/PhysRevLett.90.188501
- Mitzenmacher, M. (2004). A brief history of generative models for power law and lognormal distributions. Internet Mathematics, 1(2), 226-251. https://doi.org/10.1080/15427951.2004.10129088
- Needleman, S. E. (2020, June 22). Microsoft shutting down live-streaming service Mixer: Amazon, Google and Facebook dominate the market with their services. The Wall Street Journal. https://www.wsj.com/articles/microsoft-shutting-down-live-streaming-service-mixer-11592857054
- Novet, J. (2020, June 29). Microsoft’s withdrawal from livestreaming games fits recent trend of ‘not chasing good money after bad’. CNBC. https://www.cnbc.com/2020/06/29/microsoft-closed-mixer-after-it-failed-to-keep-up-with-amazon-twitch.html
- Pagan, N., Mei, W., Li, C., & Dörfler, F. (2021). A meritocratic network formation model for the rise of social media influencers. Nature Communications, 12(1), 6865. https://doi.org/10.1038/s41467-021-27089-8
- Roman, S., & Bertolotti, F. (2022). A master equation for power laws. Royal Society Open Science, 9(12), 220531. https://doi.org/10.1098/rsos.220531
- Scullion, C. (2021, October 6). Twitch leak reveals the site’s highest paid streamers. Video Games Chronicle. https://www.videogameschronicle.com/news/twitch-leak-reveals-the-sites-highest-paid-streamers
- Statista. (2024). Number of hours watched on YouTube Gaming Live worldwide from 2nd quarter 2018 to 3rd quarter 2022. https://www.statista.com/statistics/992392/active-streamers-youtube-gaming
- Stephen, B. (2020a, June 22). Ninja, Shroud, and other top Mixer streamers are now free to stream on Twitch again. The Verge. https://www.theverge.com/2020/6/22/21298963/ninja-shroud-mixer-facebook-gaming-twitch
- Stephen, B. (2020b, September 15). Twitch is testing mid-roll ads that streamers can’t control. The Verge. https://www.theverge.com/2020/9/15/21437787/twitch-midroll-ad-affiliate-partner-cpm
- Stephen, B. (2021, March 10). Facebook adds a path to partnership for its Level Up creators. The Verge. https://www.theverge.com/2021/3/10/22323148/facebook-gaming-partnership-twitch-affiliate-level-up
- Stewart, A., & Gilbert, B. (2020, June 27). Inside the story of how Microsoft's $75 million Mixer acquisition went from a Twitch rival to shutting down in just 5 years. Business Insider. https://www.businessinsider.com/microsoft-mixer-shutdown-inside-story-xbox-2020-6
- Takahashi, D. (2021, January 14). InvestGame: 2020 game deals hit value of $33.6 billion across 664 transactions. Venture Beat. https://venturebeat.com/games/investgame-2020-game-deals-hit-value-of-33-6-billion-across-664-transactions
- Tarascio, V. J. (1973). The Pareto law of income distribution. Social Science Quarterly, 54(3), 525-533. https://www.jstor.org/stable/42859204
- Teknos. (2024). The streamer wars: How Ninja’s defection to Mixer started the bidding war. https://www.teknosassociates.com/the-streamer-wars-how-ninjas-defection-to-mixer-started-the-bidding-war
- Tidy, J., & Molloy, D. (2021, October 6). Twitch confirms massive data breach. BBC. https://www.bbc.com/news/technology-58817658
- Twitch. (2024). Twitch partner program overview. https://help.twitch.tv/s/article/partner-program-overview
- TwitchTracker. (n.d.). Ninja's switch to Mixer. Mixer.TwitchTracker. Retrieved August 25, 2024, from https://mixer.twitchtracker.com/ninja#:~:text=Ninja's%20Switch%20to%20Mixer&text=The%20fact%20that%20Ninja%20attracted,Mixer%20to%20watch%20other%20streams
- Webster, A. (2019, August 1). Ninja announces he is leaving Twitch to stream exclusively on Mixer. The Verge. https://www.theverge.com/2019/8/1/20750393/ninja-mixer-exclusive-twitch-fortnite-streaming-gaming-announcement
- Warren, T. (2020, June 22). Microsoft is shutting down Mixer and partnering with Facebook Gaming. The Verge. https://www.theverge.com/2020/6/22/21299032/microsoft-mixer-closing-facebook-gaming-partnership-xcloud-features
Appendix A
Comparing Empirical Complementary Cumulative Distribution Function (CCDF) of Average Monthly Revenue of Twitch Streamers Selected by powerlaw Package Compared to Hypothetical Distributions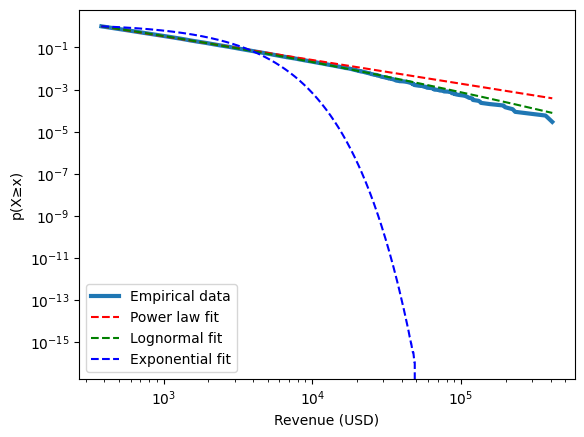
Appendix B
Comparing Empirical Complementary Cumulative Distribution Function (CCDF) of Average Monthly Income of Twitch Partners Compared to Hypothetical Distributions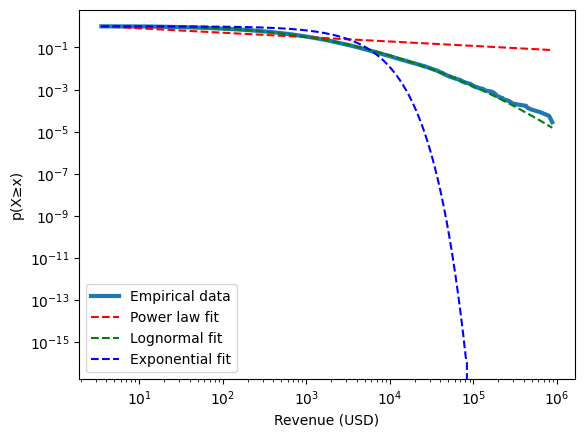
Appendix C
Comparing Empirical Complementary Cumulative Distribution Function (CCDF) of Average Monthly Income of Top 10,000 Highest Earners Compared to Hypothetical Distributions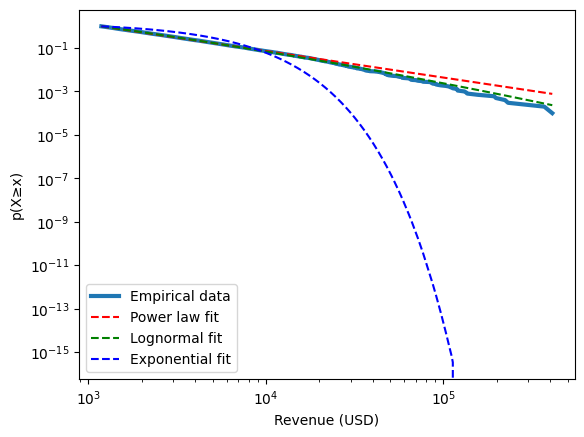
Appendix D
Comparing Empirical Complementary Cumulative Distribution Function (CCDF) of Average Monthly Income of Top 345 Highest Earners Compared to Hypothetical Distributions